
- In summary
The BCG matrix and its 4 product categories
allows for strategic analysis. It was designed by the Boston Consulting Group (late 1960s). It is widely used in corporate strategy. It allows to represent the company’s activity portfolio, according to the growth of the targeted market and its relative market share.
In the face of competition, it is useful to regularly verify the company’s positioning and to evaluate the evolution of demand in the market.
On the product side, the attractiveness of the market and the competitive position of the products are represented according to the BCG matrix below. In terms of activities, each field of activity is also represented in this same BCG matrix.
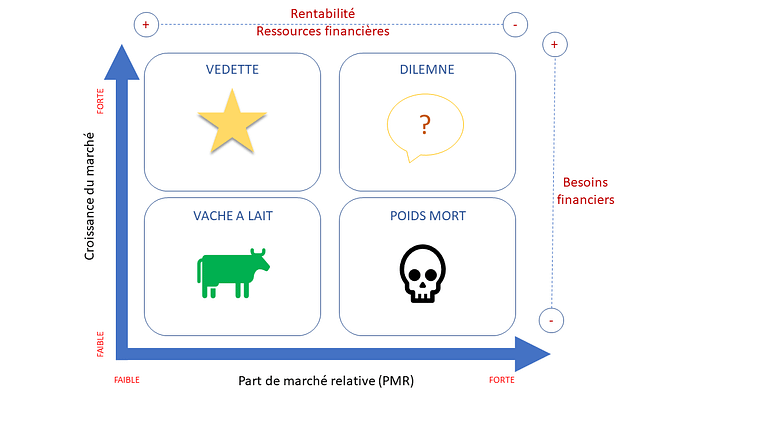
This will allow us to classify the products into four categories:
Translated with www.DeepL.com/Translator (free version)
BCG Matrix - 4 product categories

The BCG matrix contains two fundamental variables:
- Relative market share: this is the ratio of the company’s market share to that of the main competitor.
- Market growth rate: it is a function of the company’s sales evolution and/or the global sales analysis.
- Why use the BCG matrix?
The BCG Matrix and its 4 product categories allows a strategic reorientation to balance its portfolio, optimizing the allocation of resources to certain products and improving performance by strategic unit and more globally.
It is a tool that, in addition to other tools, can be used by a company at any time. Furthermore, the BCG matrix shows the evolution of a product in relation to its life cycle.
If you are creating your business, you can use it in addition to Porter’s 5 Forces Matrix to map your target market and position competing offers.
Throughout the life of a company, the matrix represents at a given moment the positioning of a company’s offerings in relation to those of its competitors (relative market share) and the attractiveness of the market (market or sector growth).
Marketing can also use it to evaluate the balance of a product portfolio, in order to visualize the profitable or struggling products.
Every company must continuously adapt to market changes and competitor positioning. The BCG matrix is a decision-making tool for the manager, allowing him to follow this evolution and adjust his offer accordingly.
- When to use the BCG matrix?
Two key moments to use the BCG matrix:
- When you are developing your marketing plan, it will allow you to define the actions to prioritize and the necessary budgets on products or SBAs.
- When launching a new product, it will help you build a more efficient strategy. You will need to know the market in its entirety in order to determine the profitability of your investment at a given moment.

The BCG matrix is not adapted to all sectors of activity: it works on companies that develop a volume strategy based on the experience effect. Not all sectors are concerned. In the luxury sector, for example, profitability is not linked to market share. Also, being in a dominant position in a market does not systematically mean that profitability is important and does not constitute a key success factor on its own.
The self-financing proposed in the matrix, between the different products or SBAs, does not take into account possible external financial resources.
- The 4 product categories
Each product is categorized according to its location in the BCG matrix. To optimize cash flow, the idea is to get a balanced portfolio where cash cows and stars will fund the dilemmas. The deadweights should be divested.
Cash cows
These are the products considered most profitable. They have a strong competitive position in a low-growth market and/or in a mature market. To maintain their position, few new investments are necessary in this category. The company’s immediate profit is assured. The cash they provide can be used to finance other projects and/or products, including those in the “dilemma” category.
The stars
These products have a large market share in a fast-growing market. They generate cash flow and constitute a strong lever for the development of the company. High investments (financial, communication, …) may be necessary to maintain their dominant position. Even if they are not always the most profitable, they are destined to become cash cows (when the market has reached maturity).
Dilemmas
Dilemmas are in a situation of low market penetration in a high growth market. They are challenged by the intensity of competition in a promising market, but are not able to succeed. Their future is uncertain and the question that the company must resolve (the Pestel analysis or the Swot) is whether to maintain them, and with what levels of investment, or to withdraw.
Deadweight
The characteristic feature of dead weights is a low penetration of the market itself, which is either slow-growing, mature or declining. The profitability of deadweight is particularly low, and even almost zero. It is in the company’s interest to divest itself of dead weights, and even to withdraw them from their offer.
Project manager since 1998, Agile since 2001 then PMO since 2009, I accompany companies in the realization of their projects/programs, in the construction and management of the PMO, in the improvement of processes and I help managers to improve their performance.
Related
Articles non similaires.
You must be logged in to post a comment.