- Summary
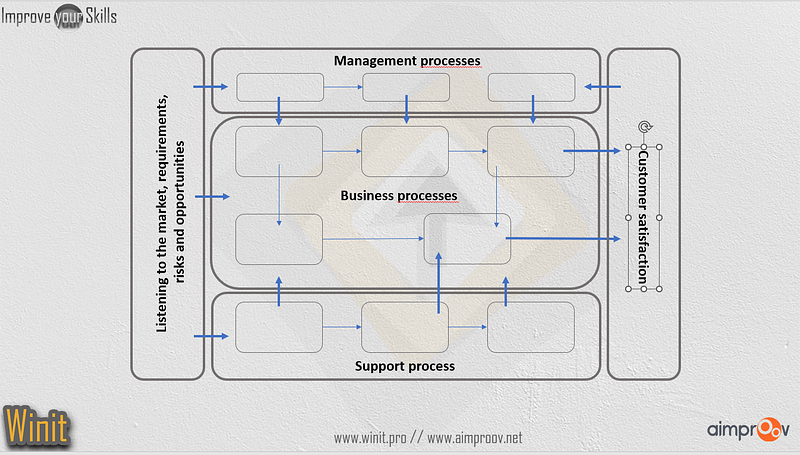
This tool aims to provide an understanding of the functioning of a company at the global level. This representation allows to show, on the same visual representation, how the company organizes its activity from the identification of its market to its final customer.
This representation is a good tool for internal communication because it provides an explicit and shared schematization of the organization’s activities.
There is no real standard formalism, but some representations have proven their relevance. This diagram corresponds to the message you want to send. The closer the formalism is to the concerns of your employees, the better your mapping will be.
Business Process Mapping

- Why use this mapping?
This type of diagram provides a synthetic view of the company’s key processes. These processes are classified into 3 categories:
- Business processes: these are the processes that are the reason for the company’s existence, those that determine how the product or service is delivered.
- Support processes: these are the processes that are necessary for the proper execution of the business processes.
- Steering processes: these processes are necessary for management to make the right decisions regarding the future and organization of the company.
Its use provides a clear vision of the company’s activities by representing them in the form of processes.
- What is the objective we are trying to achieve with this tool?
This schema is not mandatory in an organization, but it is still highly recommended to have it for :
- Compliance. Process mapping ensures compliance with best practices, regulations and standards.
- Communication. Communicating the details of a process to team members and other stakeholders is easier with mapping. For example, new employees can easily understand a business process they are involved in.
- Visibility. Mapping improves business process visibility into a process and the steps required to complete a workflow.
- Standardization. Mapping helps make process performance more standardized and consistent.
- Audit. Mapping simplifies internal auditing of processes and helps optimize process performance.
- Training. Employees can be trained more quickly and easily with business process mapping.
- Continuous improvement. It enables continuous process evaluation and improvement.
Many organizations use business process mapping tools to analyze business processes and metrics as part of business process reengineering or to improve specific steps in the process.
- What are the different types of business process maps?
There are several approaches to business process mapping. The following types are the most commonly used:
Basic Flowchart
Also known as a top-down process flowchart, this is the simplest of the common mapping types. The basic flowchart works best for simple processes. It depicts the major steps in the process in a top-down fashion, with similar tasks and activities grouped at separate points on the chart. It allows managers to easily see which tasks and activities are redundant and where steps can be eliminated and work simplified.

Detailed organization chart
It is similar to the basic flowchart, but includes more detail and is used to illustrate more complex processes.
Value Chain Map
This is a type of detailed flowchart. Value Stream Mapping techniques are often used in Lean Six Sigma methodology

Business Process Modeling Diagrams
A more formal type of process mapping, these diagrams use a specific language and BPMN (Business Process Modeling Notation) symbols to represent component tasks.
Data Flow Diagram
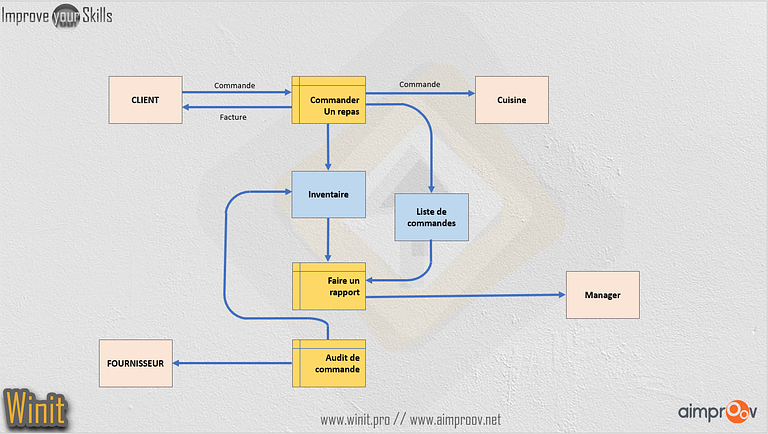
As the name implies, a data flow diagram follows the flow of the data itself through an entire process, usually from unprocessed data to processed data.
There are two types:
- Logical data flow diagram: this type of diagram focuses on the business itself. In general, it describes the flow of data within the enterprise. It is not concerned with external factors such as hardware, location and other physical entities.
- Physical Data Flow Diagram: This type of diagram shows all the implementations within the system. This includes computers, wired lines, software, and external entities such as people and organizations.

Swim-Lane Diagram
Swim lane diagrams are flow charts that show both a process from start to finish and who is responsible for each step in the process. Just like a swimming pool with lanes set up for each swimmer, the diagram has horizontal or vertical lanes belonging to each actor in the process. Instead of simply documenting the steps in the process, this style of diagram makes it easy to see responsibilities within the system and how roles fit into other parts as responsibility is transferred from one part to another. Popularized in the improvement processes of Geary Rummler and Alan Brache, a swim lane diagram (or Rummler-Brache diagram) can be extremely valuable. Some of the benefits of using this diagram are:
- Delineating the responsibilities belonging to certain individuals or departments
- Identifying bottlenecks, redundancies and unnecessary steps to streamline processes
- Ensure that all necessary parties are involved in a process
- Standardize work processes and document them in highly shareable formats

Suppliers, Inputs, Processes, Outputs and Customers Diagram (SIPOC)
This visual representation identifies the suppliers, inputs, processes, outputs and customers that are part of a process from start to finish. SIPOC diagrams are sometimes called high-level process maps.
- What are the benefits of this type of mapping?
Business process mapping provides the following benefits to users and organizations:
- clear instructions to each stakeholder on how the process should be executed;
- visibility into all process steps and tasks and their sequencing;
- Increased control of the process, with better compliance at each step;
- Continuous improvement because mapping identifies redundancies and inefficiencies and encourages business process improvement;
- Less complexity because mapping identifies and removes bottlenecks and other problems within the process;
- Reduced costs by streamlining processes;
Reduced risk of errors because everyone understands the process and how it should work; - Consistent and better integration of employees because they are oriented to a standard way of executing the process.
Business process mapping can bring many benefits to an organization, but it also presents challenges. The problems organizations encounter are often:
- not having properly defined the process, thus incorporating activities and tasks into the map that are not really part of the actual process;
- Making the map too complex with a level of detail beyond what is necessary;
- Unrealistic expectations, such as overestimating the speed at which a task can be accomplished;
- Not reviewing and updating the process map, making it irrelevant or inconsistent with how a process works in real time;
- Not integrating the maps in a way that can be used to help improve processes and overall business process management (BPM).
Project manager since 1998, Agile since 2001 then PMO since 2009, I accompany companies in the realization of their projects/programs, in the construction and management of the PMO, in the improvement of processes and I help managers to improve their performance.


You must be logged in to post a comment.